Raspberry pi Picoをデバッガで開発する
500円という破格の金額で販売されているRaspberryPi Pico。
Raspberry Piと冠がついていますが、これマイコン(すでに死語?)です。
CPUには独自開発の「RP2040」が採用されており、開発メインマシンはRaspberry Pi 4が推奨されています。
Pi4に接続して開発する手法が多々紹介されているのですが、公式ドキュメントを読むと、Pi4以外の他OSのPC(WindowsやLinuxやMAC)からでもデバッグ開発できるようにできる仕組みが記載されています。
すでにWindows10でPicoをデバッグ開発する方法は多々公開されておりますので、この記事ではLinuxで環境を整える手法を公開します。
環境
OS:Linux(Ubuntu20、MXLinux19、Debian Buster)以上のバージョンであれば動く。。。と思う。
※当然ですが、Raspberry Pi OSでも問題なく動きました。Pi3でも快適に開発できています。
開発環境構築
結論から書きますと、インストール用のシェルスクリプトをダウンロードして実行するだけで終わっちゃいます。。。
公式ドキュメントには、チャプター分けて詳しく書かれていますが、ぶっちゃけChapter1のQuick Setup Picoだけでほぼ全部終わっちゃいます。
インストールスクリプトダウンロード
公式ドキュメントにあるコマンドでいけます。
HOMEディレクトリで実行です。
$ cd ~/
$ wget https://raw.githubusercontent.com/raspberrypi/pico-setup/master/pico_setup.sh
インストールスクリプトを実行
pico_setup.shというファイルが、HOMEディレクトリにあるはずです。
pico_setup.shを実行属性にしたのち、実行します。
$ chmod 755 ./pico_setup.sh
$ ./pico_setup.sh
すると、アレヤコレヤと処理が進み、HOMEディレクトリに「pico」ディレクトリができているはずです。
treeコマンドで確認してみたら、下記の構成になっていました。
pi@KinStation01:~ $ tree -d -L 1 ./pico
./pico
├── openocd
├── pico-examples
├── pico-extras
├── pico-playground
├── pico-sdk
├── picoprobe
└── picotool
一応コンパイルコマンド叩いてみる
実のところ、インストールスクリプトの処理の中でコンパイルもやっちゃってるので、あえてここでやる必要はないんですが、、、まぁ、コマンド検証ってことで。
まずは、サンプルディレクトリに入ります。
$ cd ./pico/pico-examples
本家ドキュメントのChapter3がLチカプログラムのコンパイルテストになってるんですが、pico_setup.shを動かしたことで、すでにできてしまっています。
pico_setup.shを動かさずに個別にサンプルをコンパイルする場合を想定して。。。。
本当は自分でbuildディレクトリを作成するのですが、前述の通りすでにできているので気にせずに入ります。
$ cd ./build
んで、コンパイルコマンドを実行します。
※本家ドキュメントでは、環境変数の設定が指示されていますが、、、なんとpico_setup.shはそれもやってくれていますw
$ cmake ..
$ make -j4
すると、pico-examplesディレクトリにある全てのフォルダに対してコンパイルがかけられ、これまた全てのコンパイル結果がbuildディレクトリ下に作られます。
特定のディレクトリだけコンパイルする方法はまた次の機会に。
※$ make -j4 の「-j4」は、Pi4使ってるなら必須。
→ 「Invoking make with -j4 will run four make jobs in parallel to speed it up. A Raspberry Pi 4 has 4 cores so -j4 is a
reasonable number.」
「-j4を指定してmakeを呼び出すと、4つのmakeジョブが並行して実行され、速度が向上します。 Raspberry Pi 4には4つのコアがあるため、-j4は妥当な数。」
PicoProbe作成
無事にコンパイルができる事実を確認できましたので、手っ取り早くデバッガを仕立てます。
デバッガと書いていますが、なんのことはありません。
その正体はRaspberry Pi Picoです。
このように書くと混乱しそうですが、開発対象とは別にもう一枚Raspberry Pi Picoの基板を用意し、それをデバッガとして仕立てると言うことです。
Picoの開発を行うためにPicoを使うというのも面白いです。
Raspberry Pi PicoのBOOTボタンを押したまま、USBケーブルでパソコンと接続
USBメモリを接続したかのような画面がパソコン上に表示されるはずです。
そこに、./pico/picoprobe/build/にあるpicoprobe.uf2をドラッグ&ドロップします。
これだけで、そのPicoはPicoProbeと言う名のデバッガになりましたw
一般ユーザーでPicoProbeを使えるように設定
前項で作ったデバッガ「PicoProbe」を一般ユーザーで利用するために一工夫必要です。
何も考えず、所定のディレクトリに所定のファイルを作成して有効化します。
$ sudo nano /etc/udev/rules.d/99-picoprobe.rules
上記コマンドではnanoを利用していますが、エディタは何でも良いです。
下記の内容でファイル保存できればよいので。
# Raspberry Pi Pico probe
ATTRS{idVendor}=="2e8a", ATTRS{idProduct}=="0004", MODE="0666"
保存できたら、書いた設定を有効化します。
sudo udevadm trigger
PicoProbeでプログラム書き込み/デバッグ
ここまでで、デバッガ「PicoProbe」を使ってプログラムの書き込みとデバッグ実行ができる状態になっているはず。
早速トライ。
ハードウェアの接続
デバッグ対象となるPicoとPicoProbeを接続します。
ブレッドボードとジャンパー線でオッケー。
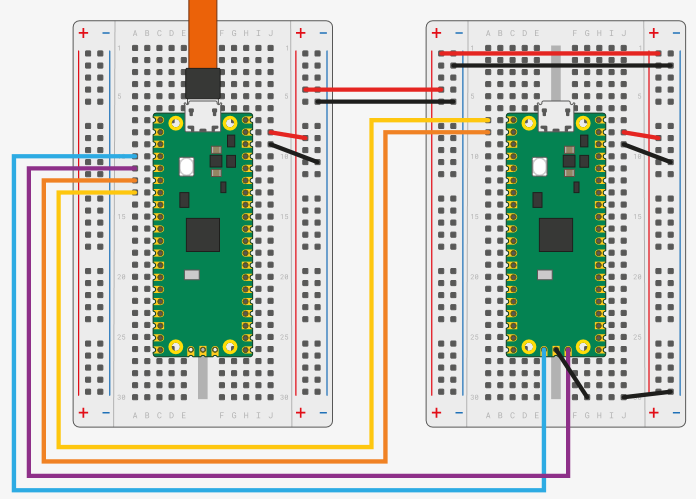

上図の通りに接続できたら、PCと上図左側のPico(PicoProbe)をUSBケーブルで接続します。
PicoProbe側のPicoのLEDが点灯するはずです。
openOCDの起動
まず、デバッグするためにLinux(GDB)とPicoの橋渡しをしてくれるプログラムを起動します。
$ cd ~/pico
$ cd ./openocd
$ src/openocd -f interface/picoprobe.cfg -f target/rp2040.cfg -s tcl
すると、配線間違いなどなければ、下記のように表示されるはず。
$ src/openocd -f interface/picoprobe.cfg -f target/rp2040.cfg -s tcl
Open On-Chip Debugger 0.10.0+dev-geb22ace-dirty (2021-02-28-13:17)
Licensed under GNU GPL v2
For bug reports, read
	http://openocd.org/doc/doxygen/bugs.html
Info : only one transport option; autoselect 'swd'
Warn : Transport "swd" was already selected
adapter speed: 5000 kHz

Info : Hardware thread awareness created
Info : Hardware thread awareness created
Info : RP2040 Flash Bank Command
Info : Listening on port 6666 for tcl connections
Info : Listening on port 4444 for telnet connections
Info : clock speed 5000 kHz
Info : SWD DPIDR 0x0bc12477
Info : SWD DLPIDR 0x00000001
Info : SWD DPIDR 0x0bc12477
Info : SWD DLPIDR 0x10000001
Info : rp2040.core0: hardware has 4 breakpoints, 2 watchpoints
Info : rp2040.core1: hardware has 4 breakpoints, 2 watchpoints
Info : starting gdb server for rp2040.core0 on 3333
Info : Listening on port 3333 for gdb connections
GDB起動→プログラム書き込み→実行
前項のターミナルはそのままに、新たにターミナルを開いてGDBを実行。
サンプルとしてLチカプログラムを書き込んでみます。
$ cd ~/pico/pico-examples/build/blink
$ gdb-multiarch blink.elf
GNU gdb (Raspbian 8.2.1-2) 8.2.1
Copyright (C) 2018 Free Software Foundation, Inc.
License GPLv3+: GNU GPL version 3 or later <http://gnu.org/licenses/gpl.html>
This is free software: you are free to change and redistribute it.
There is NO WARRANTY, to the extent permitted by law.
Type "show copying" and "show warranty" for details.
This GDB was configured as "arm-linux-gnueabihf".
Type "show configuration" for configuration details.
For bug reporting instructions, please see:
<http://www.gnu.org/software/gdb/bugs/>.
Find the GDB manual and other documentation resources online at:
    <http://www.gnu.org/software/gdb/documentation/>.

For help, type "help".
Type "apropos word" to search for commands related to "word"...
Reading symbols from blink.elf...done.
(gdb)
ここまでで、プログラムの書き込み準備ができた状態。
書き込むため、まずはGDBからopenocdに接続
(gdb) target remote localhost:3333
Remote debugging using localhost:3333
0x100020fd in ?? ()
(gdb)
無事に接続できたようなので書き込み!
(gdb) load
Loading section .boot2, size 0x100 lma 0x10000000
Loading section .text, size 0x4040 lma 0x10000100
Loading section .rodata, size 0xde4 lma 0x10004140
Loading section .binary_info, size 0x20 lma 0x10004f24
Loading section .data, size 0x24c lma 0x10004f44
Start address 0x100001e8, load size 20880
Transfer rate: 9 KB/sec, 3480 bytes/write.
(gdb)
書き込み完了!
リセットして、
(gdb) monitor reset init
target halted due to debug-request, current mode: Thread
xPSR: 0xf1000000 pc: 0x000000ee msp: 0x20041f00
target halted due to debug-request, current mode: Thread
xPSR: 0xf1000000 pc: 0x000000ee msp: 0x20041f00
(gdb)
実行!
(gdb) continue
Continuing.
Target側のPicoに実装されているLEDがチカチカ点滅したら成功です。
ステップ実行とかしてみる
ここまでで実行できたので、Breakポイントはったりステップ実行したりしてみます。
まずは、動いている状態からCtrl+cで強制終了。
(gdb) continue
Continuing.
^Ctarget halted due to debug-request, current mode: Thread
xPSR: 0x01000000 pc: 0x00000178 msp: 0x20041f00

Thread 1 received signal SIGINT, Interrupt.
time_reached (t=...)
    at /home/pi/pico/pico-sdk/src/rp2_common/hardware_timer/include/hardware/timer.h:116
116	    uint32_t hi_target = (uint32_t)(target >> 32u);
(gdb)
んで、もう一度リセットして仕切り直し。
(gdb) moniter reset init
Undefined command: "moniter".  Try "help".
(gdb) monitor reset init
target halted due to debug-request, current mode: Thread
xPSR: 0xf1000000 pc: 0x000000ee msp: 0x20041f00
target halted due to debug-request, current mode: Thread
xPSR: 0xf1000000 pc: 0x000000ee msp: 0x20041f00
(gdb)
main()にBreakポイントを貼ります
(gdb) b main
Breakpoint 1 at 0x1000035c: file /home/pi/pico/pico-examples/blink/blink.c, line 9.
(gdb)
実行してmain()で停止。
(gdb) continue
Continuing.
Note: automatically using hardware breakpoints for read-only addresses.
target halted due to debug-request, current mode: Thread
xPSR: 0x01000000 pc: 0x00000178 msp: 0x20041f00

Thread 1 hit Breakpoint 1, main ()
    at /home/pi/pico/pico-examples/blink/blink.c:9
9	int main() {
(gdb)
nextコマンドでステップ実行してみる。
Thread 1 hit Breakpoint 1, main ()
    at /home/pi/pico/pico-examples/blink/blink.c:9
9	int main() {
(gdb) next
14	    gpio_init(LED_PIN);
(gdb) next
target halted due to debug-request, current mode: Thread
xPSR: 0x01000000 pc: 0x00000178 msp: 0x20041f00
15	    gpio_set_dir(LED_PIN, GPIO_OUT);
(gdb) next
17	        gpio_put(LED_PIN, 1);
(gdb) next
18	        sleep_ms(250);
(gdb) next
target halted due to debug-request, current mode: Thread
xPSR: 0x01000000 pc: 0x00000178 msp: 0x20041f00
19	        gpio_put(LED_PIN, 0);
(gdb)
LEDが点灯するところまで実行。
きちんとステップ実行できている。
すばらし!!
終わり方
detachコマンド実行してから、quitコマンド。
(gdb) detach
Detaching from program: /home/pi/pico/pico-examples/build/blink/blink.elf, Remote target
Ending remote debugging.
[Inferior 1 (Remote target) detached]
(gdb) quit